
Do you ever feel lost when attempting to quantify the progress and momentum of the synthetic biology field? Or perhaps you’re a student, a new iGEM team, or a software engineer that has stumbled across this idea about making biology more predictable, but have trouble finding quality, reliable sources for learning more about the field’s structure, the cogs in the wheel, so to speak, in simple terms without jargon. While it’s great to use general examples about how easy it is to biohack or do-it-yourself -- and those are certainly fantastic parts of the field's pitch -- many individuals, agencies, and investors would appreciate a more quantitative message.
For instance, I’m currently in discussions with an undergraduate student majoring in the biological sciences that sees synthetic biology as the best way to help the most people with novel medical technologies. And a PhD student seeking ways to break into the field, either through a startup or partner company. And a software engineer intrigued by the parallels between 1s and 0s and As, Ts, Cs, and Gs. And quite a few more.
I’ve listened to frustrations from founders of startups on recruiting trips about their difficulty helping potential hires visualize the momentum of the field. The government of the United Kingdom, which elevated synthetic biology to one of the Eight Great Technologies, would sure like to see real data demonstrating the value of its investments and vision. iGEM teams may be more encouraged to commercialize their ideas if they knew of the opportunities and avenues available.
In other words, there’s tremendous value to tracking the field’s progress. That’s why we’ve been hard at work finding, analyzing, and compiling data detailing the growth of synthetic biology. Today, I’m happy to provide a sneak-peek into a new project here at SynBioBeta. Shortly after we launch a redesigned website in January 2015 we’ll open an interactive company database to the community with the hope of providing solutions to the problems above.
What’s in the database?
Currently, we’re tracking the total number of companies, partnerships, investors, community labs, and accelerators/incubators. The data will be sortable by year of synthetic biology work (year founded for many companies), year of partnership, primary industry, and numerous tags including host organism, target markets, iGEM roots, and more. We also envision including global maps of each company’s location, which could be sorted by year founded or primary industry (we’re working with Google Maps Engine and others to find the most suitable tool).
We envision making it interactive by allowing the data to be viewed, sorted, and downloaded by anyone. Additionally, we acknowledge that we’ll miss a few companies here or there, miscategorize companies from time to time, or drag a spreadsheet cell too far by mistake -- so the community will be able to make suggestions to improve the database. After all, it’s not for us, it's for you. The more accurate the data the better for everyone.
What do the data look like right now?
In one word: awesome. The charts below are even more impressive when you consider that they’re incomplete (known errors explained below). We’ve characterized 162 companies in the synthetic biology field, with an additional 10 companies that are in stealth mode or have yet to be accurately categorized by industry or year founded. I already know I have a list of new companies coming my way next week - so this is not quite up to date!
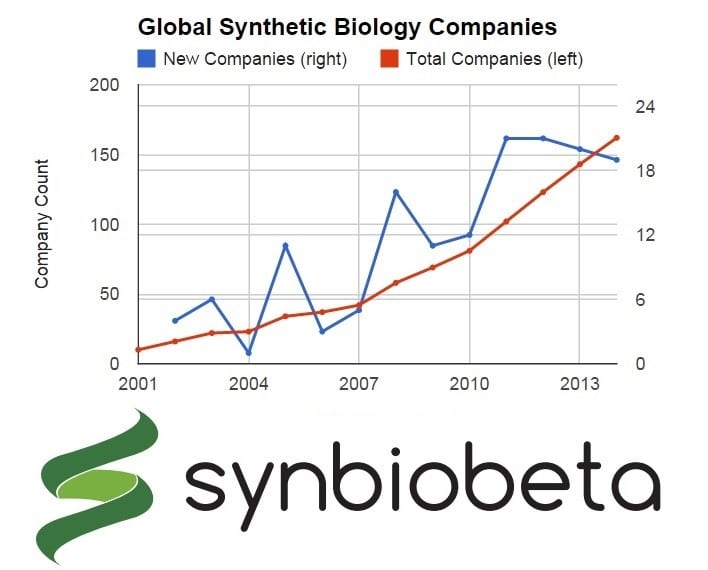
As you can see, 2014 will mark the fourth consecutive year that 20 or more companies have been founded. I will caution that the more recent the year, the less complete the data. For instance, we’re still discovering companies founded in 2012 and 2013. Luckily, the accuracy of the database will improve once the community gets to dig through it. Nonetheless, it would be interesting to see how overall company growth compares to the falling costs of synthesized DNA or launching a startup.
We can also use the database to see which industries have the most traction and/or investment -- and which are gaining momentum before they're picked up by mainstream media or investors. Consider that industrial biotech companies make up the bulk of the companies in the database, but several industries, such as bioCAM, have made big gains in recent years.
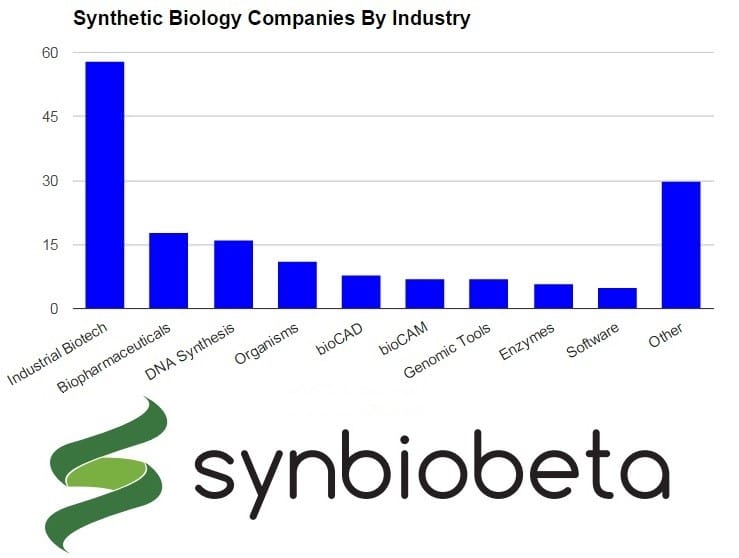
The same errors from the first chart apply to the chart directly above. The "other" category in the chart above is displayed in individual industries in the database, but was aggregated for simplicity here. It includes engineered molecules, tissue engineering, diagnostics and sensors, stealth mode, and more. I should note that we will also breakdown each industry by target markets. For instance, an industrial biotech company may be able to sell products into the flavors and fragrances, fuels, foods, and other industries -- another interesting way to zoom into the growth of specific sectors and markets.
Meanwhile, while I know the following data set has the most error at the moment, it’s spectacular to see the momentum of even the incomplete data of partnerships made with and between synthetic biology platforms.
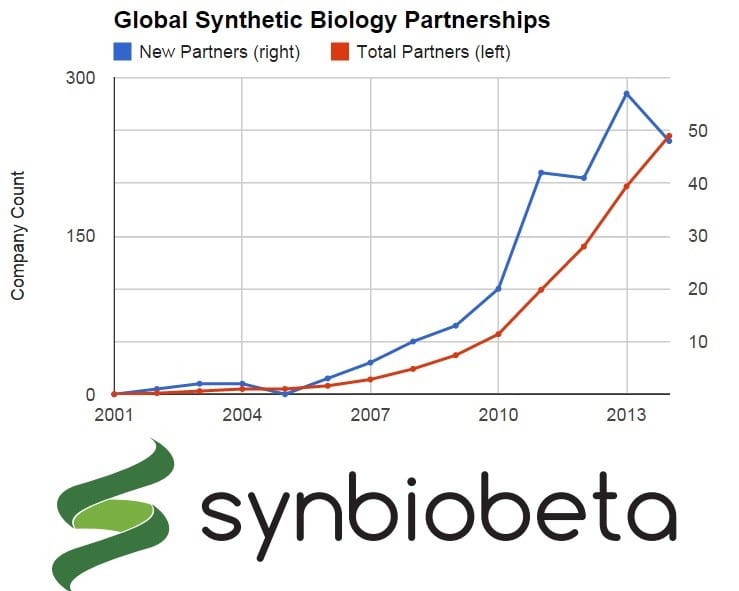
Why does this have the most error? Well, there are more partnerships than companies and we’ve only worked our way down the list of companies beginning with the most represented industries (industrial biotech, then bioCAD, then…). As this becomes more complete and accurate, will the number of partnerships formed go exponential? It’s awfully close already. Once again, I will caution that the more recent the year, the less complete the data. So I wouldn't necessarily pin 2014 as a down year for partnerships just yet.
What else is in the works?
I have some additional ideas to enhance and build upon these data with specific groups (governments, investors, iGEM, and the like), but we’re interested in hearing from you! Specifically, I would like to add more detailed investment and iGEM data to the list, while we could also add patent data (silly imperfect patent data), too. It would be interesting to quantify the success of open-source platforms in comparison to patented platforms, wouldn’t it? Maybe investors are relying on old-world fallacies when forming opinions of patented platforms in biology, or patents on the wrong entities (organisms instead of actual products created from those organisms). Perhaps governments will discover problems with current patent laws covering biology and seek reform (ahem). That’s all possible with this data set and your suggestions.
When can I get my hands on it?
The database will likely launch in the first quarter of 2015. We’re considering allowing beta testers to run wild in a sandbox mode to provide suggestions and find any bugs before we launch to the general public, so register at https://synbiobeta.com/company/ if you’re interested. Otherwise, rest assured that by this time next year we’ll finally have a better way to quantify the progress and growth of the field.
Read More

Newletter & More


SynBioBeta
Join the innovators shaping the future with SynBio + AI. From health to ag, materials & more—be part of the revolution.


